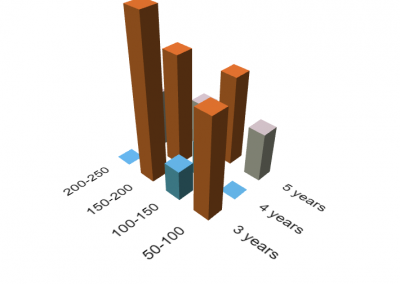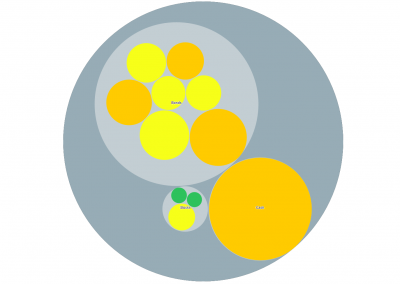
One of great features of BellaDati is the ability to use custom-made charts. By default BellaDati contains a large number of different charts and visualizations. However in some cases a specific chart is required. Therefore BellaDati allows users to create or adapt charts made with D3.js or any other library.
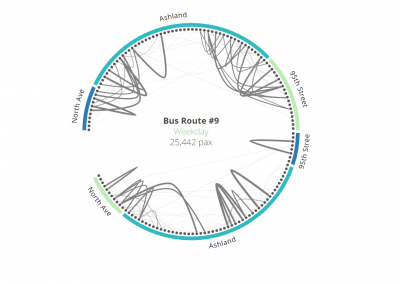
BellaDati can collect data from any data source (e.g. sensors and other) and then display them in a report. A chord diagram displays data arranged radially around a circle with the relationships between the points drawn as arcs connecting the data together. The can be used for visualizing data from public transportation, for example bus routes.

Pricing
| Version | Unlimited |
| Number of Users | Unlimited* |
| Price | Free |
*limited to the number of users of the BellaDati license
Installation
- Download the ZIP file with extension by clicking on button in top right corner.
- Go to BellaDati Extension gallery and upload the ZIP file.
- Activate the extension.
Usage
For this extension to work correctly, a specific data set and report needs to be created. Please contact sales@belladati.com for more information.
You can see demo of this chart on our Governmental Open Data Portal.